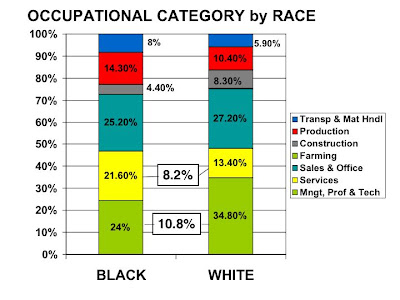
The exploration of racial disparities in production work leads causes one to question whether similar disparities exist across other occupations.
Again, working with the custom table feature and Census 2000 SF 4 at American Factfinder, one can generated data by occupation classification for whites and blacks across the county.
Here is a comparison. One can see that blacks lead in certain occupational groupings, particularly services (but also in production and transportation and material handling), and whites in managerial, professional and technical work (but this group does have a substantial black presence). Within the professional & managerial group blacks have more of a concentration in community and social services and education, while whites are more in top level corporate jobs and things like engineering.
The really interesting differentials are in services.
This is the category where blacks are the most. But where are they? Services has four subcategories:
- Personal Services
- Building and Grounds Maintenance
- Protective Services
- Food Preperation & Services
- Health Care Support Workers
 Whites, however have a very high concentration, nearly a third, in Food Service: waiters, waitresses, food prep, chefs, short order cooks, etc.
This was sort of unexpected, so let’s take a closer look at white food service workers. Graphing tracts with white food service workers, the UD area just dominates, probably due to college kids waiting tables for their tuition, so that tract is a special case.
Beyond that one can see some breaks and clusters
 Which map out so:
 The even spread out into suburbia , including the top tracts seems to indicate that this is probably a situation of teenagers and college kids working in fast food or other food services, since this sample is based on “working adults 16 years or over”.
 Interesting to see one of the top tracts mapping out near UD: perhaps the “student ghetto”, the true off-campus student ghetto, not the “UD Houses” off Brown Street, but the area east of UD. It would be interesting to map out young adults to see if there is a geographic correlation, to see if there is indeed a second student ghetto back behind Woodland Cemetery.
We’ll take a closer look at young adults next, which will be considerable more accurate as the census does basic demographics as a 100% count, not a sample.

No comments:
Post a Comment